From the neurobiological point of view, "resonance" effects of rare, short and strong pulsatile electromagnetic radiation (EMR) (possessing negligible total energy) upon nervous tissue are of special interest. We firstly studied low frequency (6 Hz, basic theta-rhythm predominating in both active wakefulness and paradoxical sleep of the rodents), super-broad band, ultra-short (1-2 ns), powerful (field intensity 100-130 V/cm) electromagnrtic impulses on EEG and sleep-waking cycle of laboratory rabbits.
During 1 hr exposure 4 animals (preliminary implanted under local procain anesthesia with conventional electrodes for cortical, hippocampal and olfactorial EEG, and neck EMG recordings) were placed simultaneously into individual narrow wooden boxes with their heads directed to the side of parabolic antenna of electromagnetic wave radiator at the distance of 1 m from it. Otherwise the same animals exposed in front of the switched off radiator were used as controls. Exposition took place between 8:00-9:00 PM. Then the animals were transferred to their habitual individual chambers and a 22-hr continuous paperless polygraphic recording was started at 9:30 PM simultaneously with the beginning of 12 hr dark period. After the experiments had been completed, the recordings were scored visually, and hourly percentages of wakefulness (W), slow wave sleep (SWS) and paradoxical sleep (PS) for both experimental and control conditions were averaged, compared and analyzed statistically using Mann-Whitney U-test.
EMR evoked no clear disturbances in general appearance, behavior and body temperature of the animals. As it can be seen from the Fig. 1, hourly SWS percentage was not changed too, either during the initial 12-hr dark or the following 10-hr light period in the chambers. However, a total sleep time (Fig. 2) has demonstrated a non-significant tendency to decrease in SWS during the dark period followed by a correspondent rebound, so the difference between total amount of SWS in the dark and light periods increased and reached the level of significance (р<0.05; N=8).
The most important effect was a pronounced increase in PS delayed for as much as 16 hr from the end of the exposition. The tendency to increase in PS percentage which was clearly seen within 17-19th and 21-22nd hrs, reached significance level at the 18th and 19th hrs (Fig. 1). Generally, despite a weak tendency to decrease in PS at the beginning of the light period (12th-16th hrs), its total duration for the entire 10-hr period (Fig. 2) was significantly higher (increment more than 40%, p<0.05) as compared to the control value (100%).
The above mentioned influence of EMR on sleep seems to be surprising: we could not find similar descriptions in the literature. If the effect on SWS could be explained by a slight homeostatic disbalance (radiation stress evokes a slight suppression of sleep followed by a restorative rebound), the pronounced and delayed increase in PS is an order higher than its preceding negligible loss which might be regarded as a result of radiation exposure. The reason of such an effect is unknown; however, direct "resonance" effect of low frequency strong electromagnetic impulses upon "biological clock", that is the supra chiasmatic nucleus (SCN)/pineal system, as well as the system generating PS in a lower brainstem, could not be excluded.
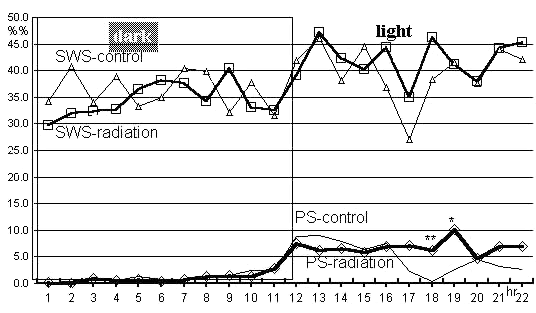
Figure 1. EMR effects upon rabbit sleep: hourly time-course.
X-axis: recording hours;
Y-axis: percentage of sleep (60 min = 100%);
*p<0,05; **p<0,01 (N=8, U-test).
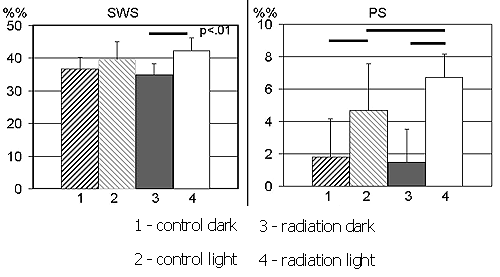
Figure 2. EMR effects upon rabbit sleep: total effects for the entire 12h recording periods (means and SDs).
Horizontal lines indicate significant differences between groups.
Correspondence: V.M.Kovalzon
Severtsov Institute of Ecology and Evolution
Russian Academy of Sciences
33 Leninsky Prospect, 117071 Moscow, Russia
E-mail: kovalzon@mail.ru